Monitoring And Diagnostics App Service Plan
tags:
- App Service Plans
- App Service
- Azure
- Monitoring
- Diagnostics
Short-hand:
- AS - App Service
- ASP - App Service Plan
This will be the last blog in this series for Managing Azure App Services plans. In this blog I will give you an overview on monitoring and diagnostics for App Service plan. We will cover enabling logging, configuring logging, monitoring metrics and Application insights. Now let’s get into an overview of Monitoring and Diagnostics for App Service Plans.
Overview of Monitoring and Diagnostics
There are two categories for capturing Monitoring and Diagnostics for an App Service Plan. First, we have Azure monitor which monitors the App Service plan. Next, there is Azure Logging which captures logs for your application running in an App Service plan. Those logs can be stored either on the App Service server or in an Azure Storage container. Let discuss these two categories in depth.
Azure Monitor
Azure monitor service can collect telemetry metrics for you App Service Plan. This collection of metrics can either happen on you on-premise or Azure environment. Some of the basic metrics Azure Monitor can collect include:
- CPU Usage
- Memory Usage
- I/O Usage
Here is a link to a full list of metrics Azure Monitor can collect - https://docs.microsoft.com/en-us/azure/azure-monitor/platform/metrics-supported
We can also setup alerts in Azure Monitor when specific metric thresholds are reached. One thing to note is Azure Monitor includes Azure Log Analytics and Application Insights. For Azure monitor we are charged on per GB usage. Log Analytics is an Analytics engine and management solution which includes its own query language. With Log Analytics the management solution collects data from various sources which then can be queued with pre-defined queries Log analytics provides.
Application Insights monitors the overall health of your App Service Plan. This can monitor your App availability, App Performance, and App usage. You can configure Application insights either internally which will include code changes or externally which does not include code changes. There are visualization tools build into Application insights that allows you to get a high-level graphical view of your application. This allows you to see how data is flowing through your application. Application insights supports a verity of languages whether they are supported by Microsoft or the community.
Link to what languages are supported by Application Insights - https://docs.microsoft.com/en-us/azure/azure-monitor/app/platforms
Now let’s configure Application logging!
Configuring Application Logging
If you are using the ASP.NET or ASP.NET Core framework you can utilize the use predefined system classes to configure application monitoring.
ASP.NET - System.Diagnostics.Trace
ASP.NET Core - ASP.NET Core - Microsoft.Extensions.Logging.AzureAppServices
(Not included in Microsoft.Asp.NetCore.AppMetaPackage)
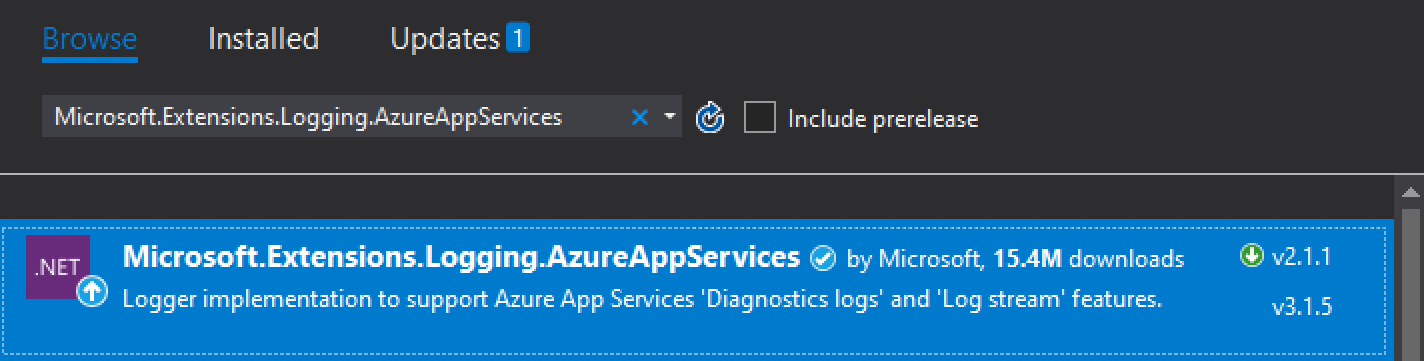
We can use these classes to log data to a console window and/or add logging to Azure. Open the solution file to you project and open ‘Solution Explorer’. Right click on ‘Dependencies’ and click ‘Manage NuGet Packages’. Search for ‘Microsoft.Extensions.Logging.AzureAppServices’ and install it into your solution.
Once installed, if you expand the ‘Nuget’ folder in your solution you will see the package. Now we will need to configure logging in the main ‘Program.cs’ file. We need to add a ‘using’ statement at the top of the program file to use the extension.
Code - ‘using Microsoft.Extensions.Logging;’
In the main method in the ‘program.cs’ program file we want to configure logging by adding the following code to the ‘IWebHostBuilder’ method.
Code - ‘.ConfigureLogging(logging => logging.AddAzureWebAppDiagnostics());’
IWebHostBuilder method -
public static IWebHostBuilder CreateWebHostBuilder(string[] args) =>
        WebHost.CreateDefaultBuilder(args)

            .UseStartup<Startup>()

        .ConfigureLogging(logging => logging.AddAzureWebAppDiagnostics());
To configure the output for the logging message you can add code to the individual program files in your application. You will need to add the ‘using Microsoft.Extensions.Logging;’ to the top of the files you are configuring logging on. This allows you to call methods and functions for the NuGet package we added earlier. Once configured we can build the code locally and push it to Azure App Service.
Enabling logging in the Azure App Service
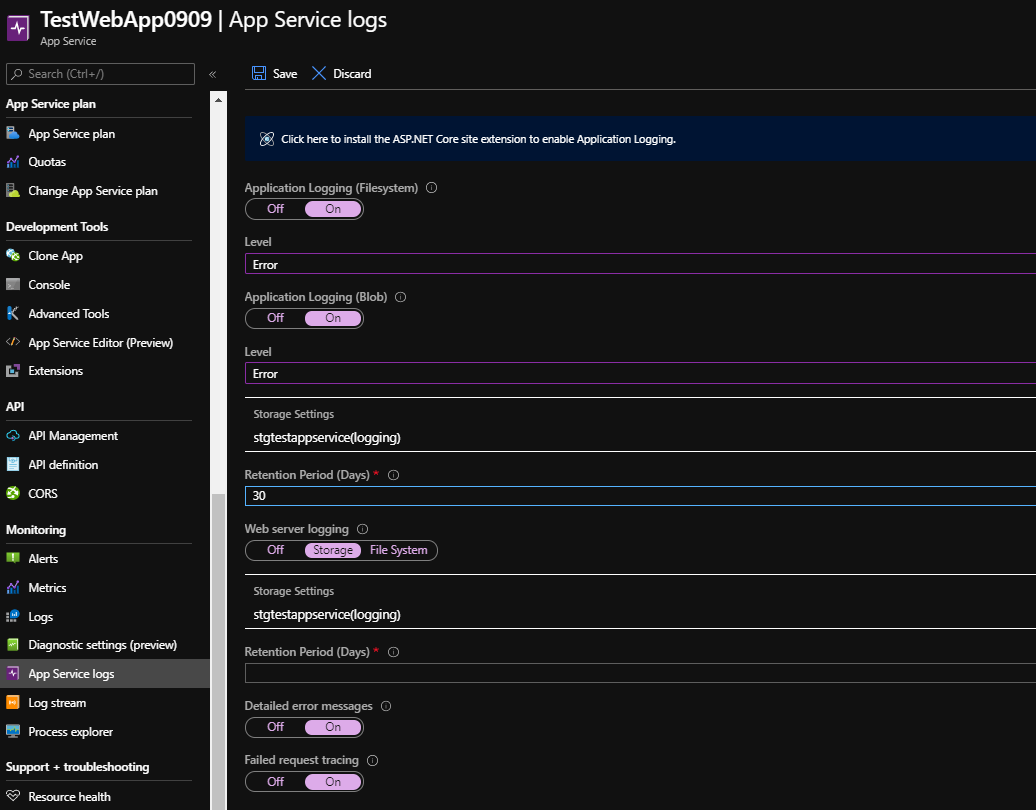
Log into the Azure portal and navigate to the App Service you would like to enable logging. Click on the ‘App Service Logs’ tab, by default all the logging is turned off. The ‘Application Logging (Filesystem)’ setting will enable the configuration settings we just applied to out application. These logs will then be written to a local file on the App Service file system. Note: This setting will only be enabled for 12 hours and then will be automatically disabled. This allows for a troubleshooting window. This gets disabled by default because it is resource extensive. There is an option to capture the level of error logging for the web application, which are listed below.
Level
- Error
- Warning
- Information
- Verbose
The logging you specified in code will correspond to the level you set under this option. There will be a ‘LogFiles’ directory that gets created on the App Service. This is where we can go to grab the logs for troubleshooting. Keep in mind all the files located on the App Service can be streamed from the App Service to your local or a shared drive by using the Azure CLI. This comes in handy when you are troubleshooting issues from the past. Above we mentioned that the log ‘Application Logging(File System)’ gets disabled by default after 12 hours, we can enable the ‘Application Logging(Blob) which will write the log files to a blob storage container.
There is an option to set the retention on the log files kept in the storage blob. Under the Application Logs section there are options to enable ‘Web Server Logging’ logging, this allows you to capture http/https and IP address requests from the IIS VM Servers allocated to your App Service Plan. These logs get store on the App Service file structure under the ‘http’ folder. Additionally, we have an option to capture ‘Detailed Error Messages’ for the App Service which is linked to the folder named ‘DetailedErrors’ on the App Service. The last option to enable for logging is called ‘Failed Request Tracing’, this allows you to capture the failed request hitting your App Service. The folder on the App Service that corresponds to the ‘Failed Request Tracing’ is prefixed with ‘W3SVC’.
App Service Directory Logging Mapping
- Application Logging (Filesystem) - .\LogFiles
- Web Server Logging - .\http
- Detailed Error Message - .\DetailedErrors
- Failed Request Tracing - .\W3SVC…….
There is a tab in the Azure App Service called ‘Log Streaming’ which allows you to view generated logs in your App Service in real time. This comes in handy when you are troubleshooting an ongoing issue with your App Service. We can which between the ‘Application Logs’ and the ‘Web Server Logs’ to view generated logs in real time. There are additional options to clear, pause and start the log streaming. I haven’t used this tool much in the past but it may come in hand for you and your team when tracking down complicated issues. We talked about the different types of logs we can generate for and App Service. Next, we will talk about Monitoring your App service by using metrics.
Monitoring Azure App Service
Navigate to your App Service in Azure and click on the ‘Overview’ tab. At the bottom of the screen we get a few predefined metric graphs that Azure provides out of the box. Azure you allow you to edit each graph by double clicking on the graph. We can choose a time frame we would like to view in the chart by clicking on the ‘Local Time’ icon on the upper right-hand side of the screen. Also, on the right-hand side we can change the chart type by clicking on the ‘Line Chart’ drop down and choosing a different type of chart. We can drill down into the chart to see what scope of metrics the graph is showing. Click on the oval with the name of the app service and metric scope.
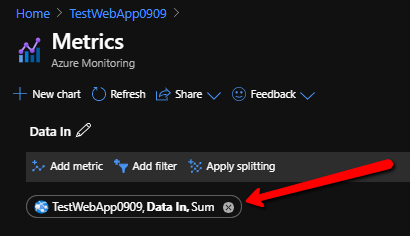
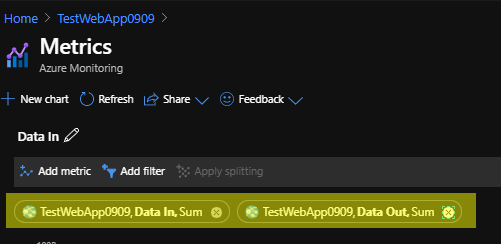
Inside the metric scope we can change the scope of the metric to pull back different data points and configure the aggregation. Azure provide a wealth of data points that you can configure. Another cool feature that Azure provides is it allows you to pull multiple data points back in a single graph. So, we could configure ‘Data In’ and ‘Data Out’ in a single graph.
We can export the graph in excel format if needed. Additionally, we can pin and rename the graph as needed. Let’s look at how we can setup alerts on these metrics!
Setting up Alerts for Metrics
Search for ‘Monitor’ in Azure and then select the ‘Metrics’ tab on the left-hand side of the screen. We can scope our metrics to any resource in the Azure subscription. In our case we will be scoping the metrics to the App Service plan we created in a previous blog. When clicking on the ‘Metrics’ tab a new window will appear to define the scope of the metrics. Select the resource you would like to capture the metrics on and click ‘Apply’. This allows you to capture multiple graphs from various Azure resources on a single-pane of glass. I thought I would mention this feature before moving on to setting up alerts for metrics.
Select the ‘Alerts’ tab and click ‘New Alert Rule’. Here we can select the resource that we would like to alert on by selecting the ‘Select Resource’ link. Select the resource that you would like to alert on a click ‘Done’. Under the ‘Condition’ section we can click ‘Select Condition’ which will allow us to configure the condition we would like to be alerted on. In our case we are going to select the “CPU Percentage’ metrics. At the bottom of the screen we can narrow down which instances we would like to be alerted on. Since the App Service is running on an App Service Plan there could be multiple instances provisioned depending on auto-scale. In our case we want to be alerted on all instances in the App Service plan.
Under the ‘Alert Logic’ we can specify when we want to be alerted. For example, we want an alert to be created when the ‘CPU Percentage’ is ‘Greater than’ the ‘Average’ threshold of 70%. There are three options under ‘Alert Logic’ which will need to be defined for your alert.
- Condition
- Time Aggregation
- Threshold
Under the ‘Evaluated Based On’ section we can configure how long this condition needs to be met before sending an alert. For example, if the ‘CPU Percentage’ exceeds 70% for 5 minutes then we wanted to be alerted. We can configure the ‘Frequency’ this metric is check by changing the ‘Frequency’ option to ‘Every 1 Minute’. This will allow Azure monitor to check to see if this condition is met every 1 minute. Once configured click ‘Done’ and an estimated monthly charge will be set showing you how much the alert is going to cost.
Below we can add an ‘Alert Rule Name’, ‘Description’ of the alert and its ‘Severity’. There is also another option to ‘Enable rule upon creation’ which will enable the alert automatically. At the bottom of the screen we can define an action group. This allow us to configure actions to be taken when the alert condition is met. We are going to configure an ‘Action Group’ to send out an email message to myself when the alert condition is met. Select ‘Create Action Group’ button and specify the name of the ‘Action Group’. Under ‘Actions’ we are going to name the action ‘Send Email’ and change the ‘Action Type’ to ‘Email/SMS/Push/Voice’. Under ‘Edit Details’ we can specify the email address we would like the alert to be send to. Click ‘Ok’ and then on the ‘Action Group’ page click ‘Ok’
Now we have successfully set up an alert in Azure monitor which is going to send an email out when our condition is met. We have talked about configuring logging for App Services and configuring alerts based on metrics captured in the App Service. This blog will end our series on Managing Azure App Service Plans.
Until next time! Cheers!
Jared Clark